


O
pen Map Data is always a great resource to generate beatiful plots with code. In this case we are leveraging the data made available through OpenStreetMap to generate paintings of our cities.
The osmdata package in r, allows us to query directly all the map layers. The map is organized in features and tags. SOn you can search for anything you want and use it in a plot. In those case I am using city streets, highways, railroads and subways to plot a city.
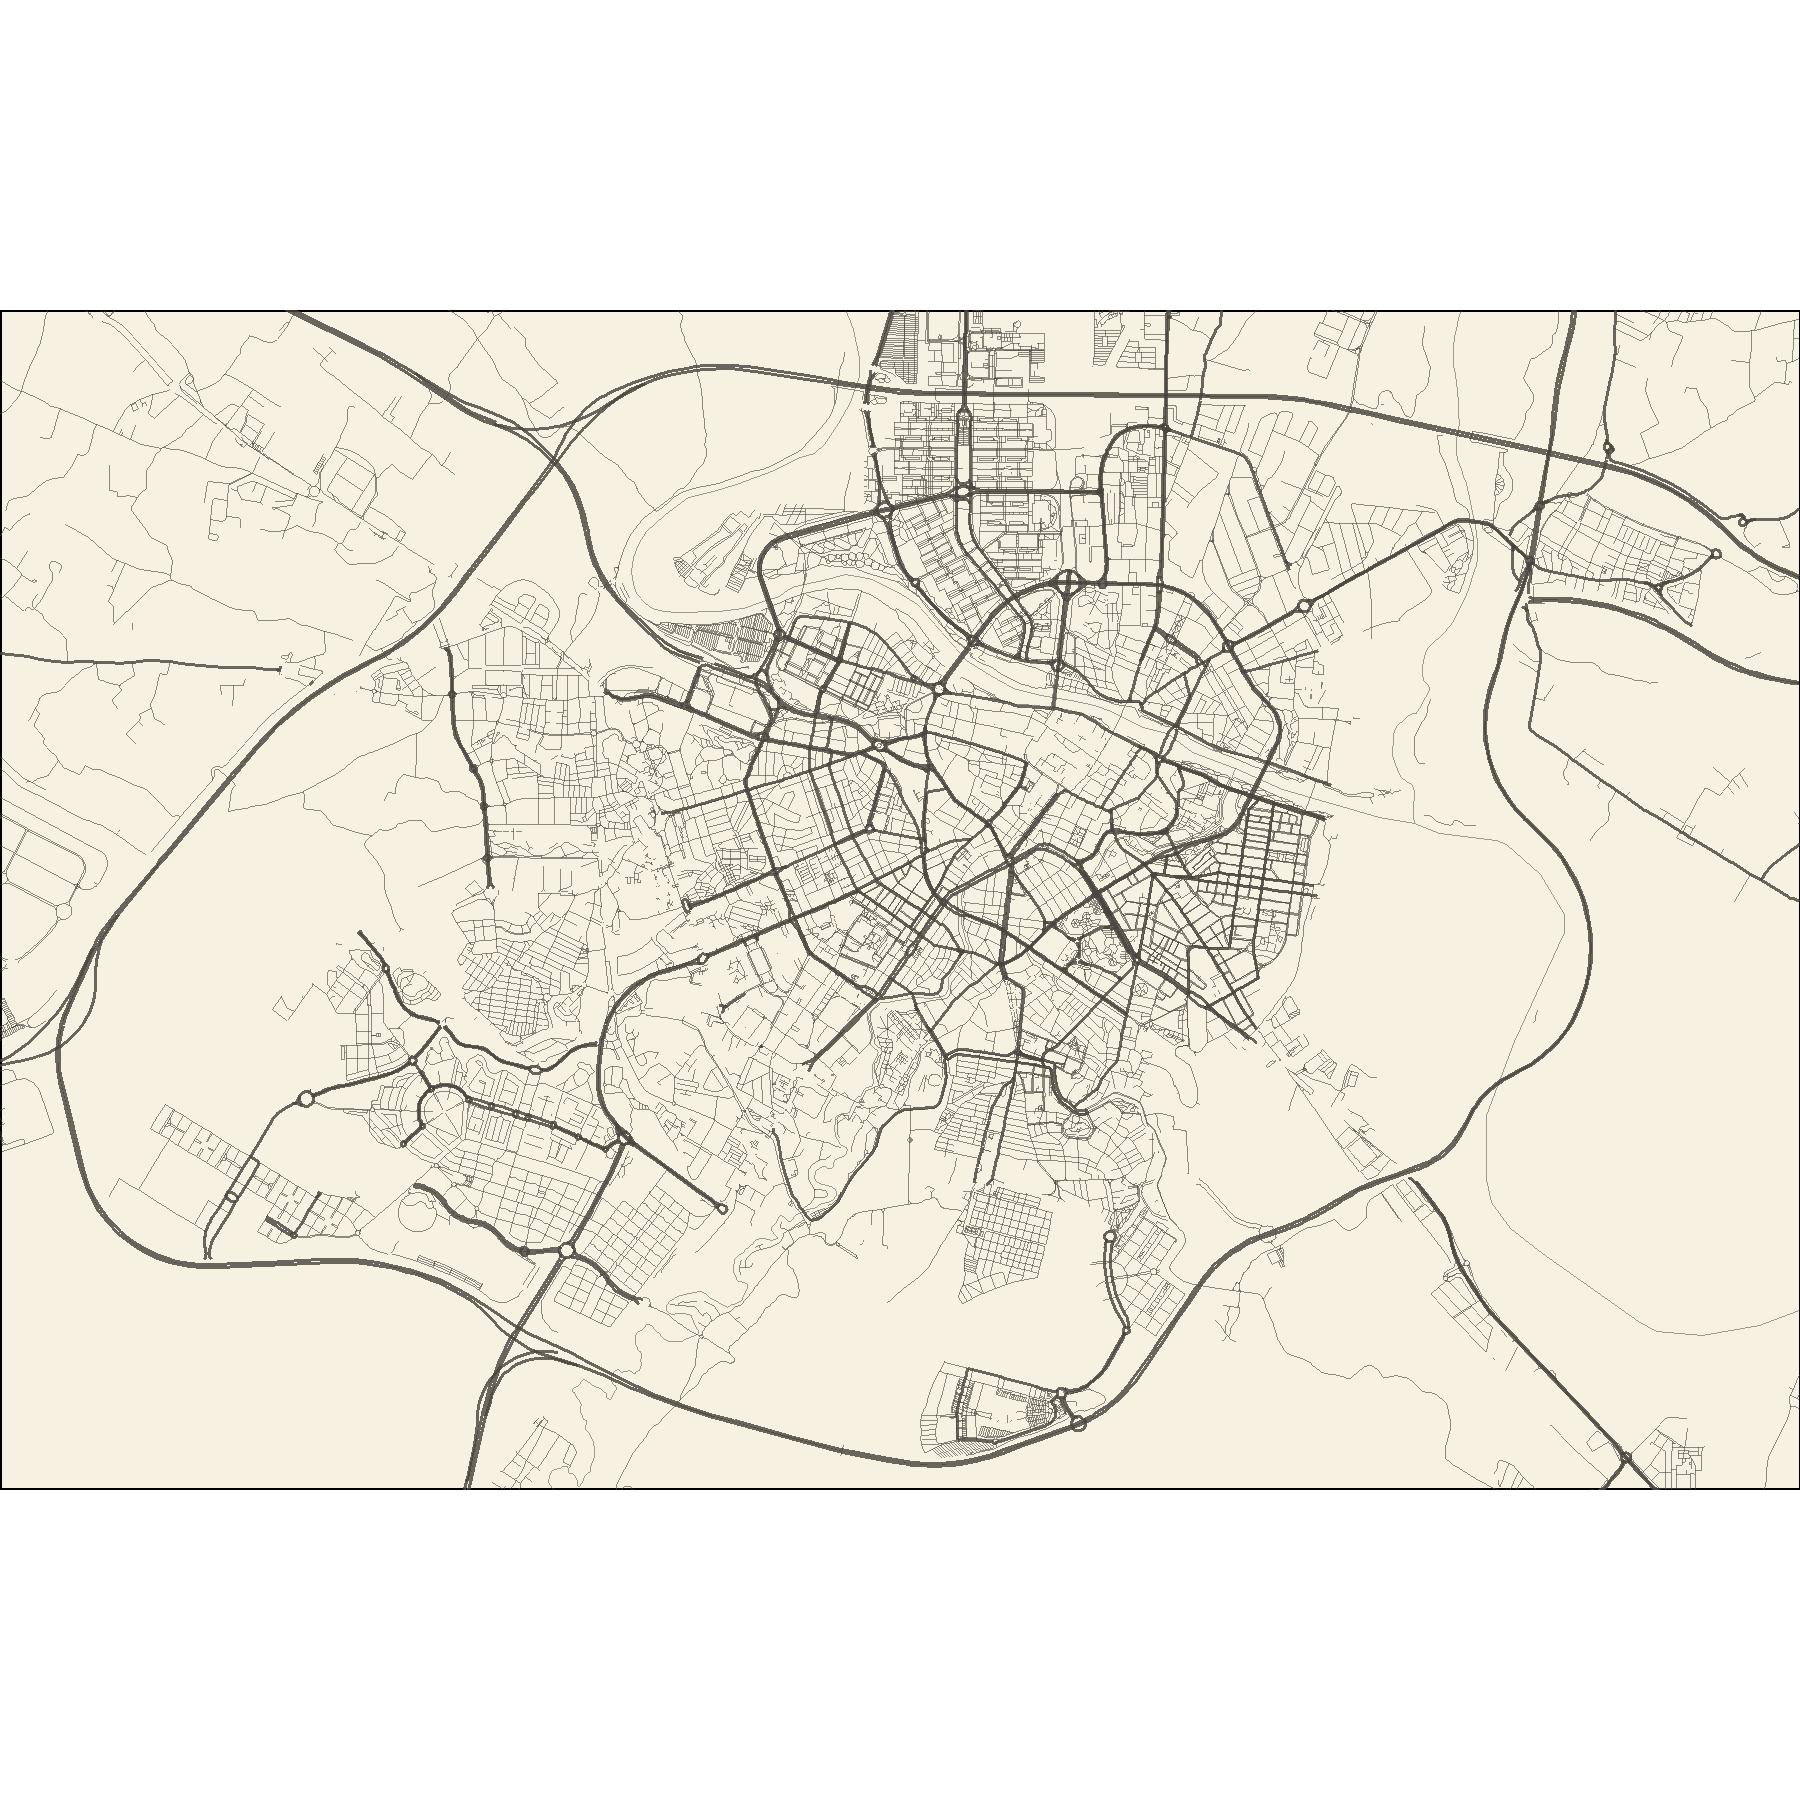
The key is to play with the colors and the widths of the lines, as well as choosing the right color palette. It´s very similar to what you can purchase for 20€ online, but it´s free instead

